Flowcharts
1. Introduction to Flowcharts
Flowcharts are graphical representations of algorithms, workflows, or processes.
They use standardized symbols to illustrate the steps and decision points in a process, making it easier to visualize and understand complex procedures.
2. Key Principles of Flowcharts
2.1 Clarity and Readability
Flowcharts should be easy to follow and understand, even for those not familiar with the specific process being described.
2.2 Consistency
Use standardized symbols and follow consistent conventions throughout the flowchart.
2.3 Simplicity
Break down complex processes into simpler steps, using sub-processes where necessary to maintain clarity.
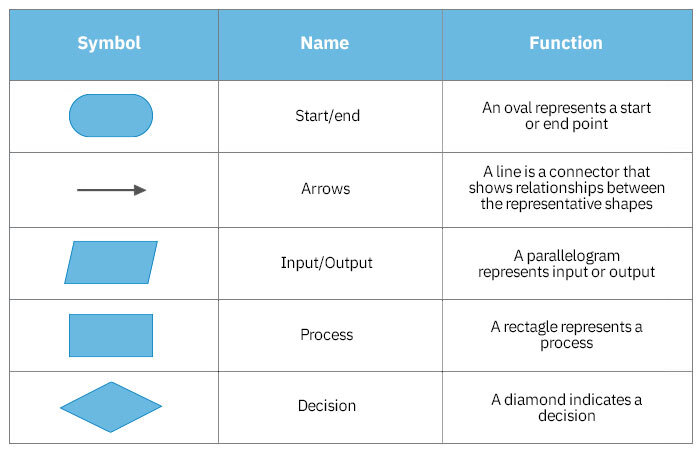
3. Standard Flowchart Symbols and Their Meanings
3.1 Oval (Terminal)
- Represents the start or end of a program or process.
- Typically contains "Start" or "End" text.
- Indicates the entry and exit points of a flowchart.
3.2 Arrow (Flow Line)
- Shows the direction of process flow.
- Connects different elements of the flowchart.
- Indicates the sequence of operations.
3.3 Parallelogram (Input/Output)
- Represents input or output operations.
- Used for displaying data entry or results.
- Can indicate manual input, printed output, or displayed information.
3.4 Rectangle (Process)
- Represents a processing step or action.
- Indicates any operation where data is manipulated or changed.
- Can represent calculations, data transformations, or function calls.
3.5 Diamond (Decision)
- Represents a decision point or branching in the process.
- Contains a question or condition that can be answered with "Yes" or "No" (True or False).
- Has two outgoing arrows, typically labeled with the possible outcomes.
4. Tools for Creating Flowcharts
Use any of the tools below to create flowcharts for your assignments:
- Exacalidraw
- FigJam
- Microsoft Visio
- Lucidchart
- Draw.io
- SmartDraw
- Creately
These tools provide templates and drag-and-drop interfaces for creating professional flowcharts.